

Weekly Scan Heatmap & Excel Reporting
WaanKit's advanced reporting suite features a Temporal Scan Heatmap for discovering peak customer activity windows, alongside an Excel (.xlsx) Export tool for seamless reporting to leadership and integration into business intelligence pipelines.
1. Weekly Scan Heatmap (24h x 7d Matrix)
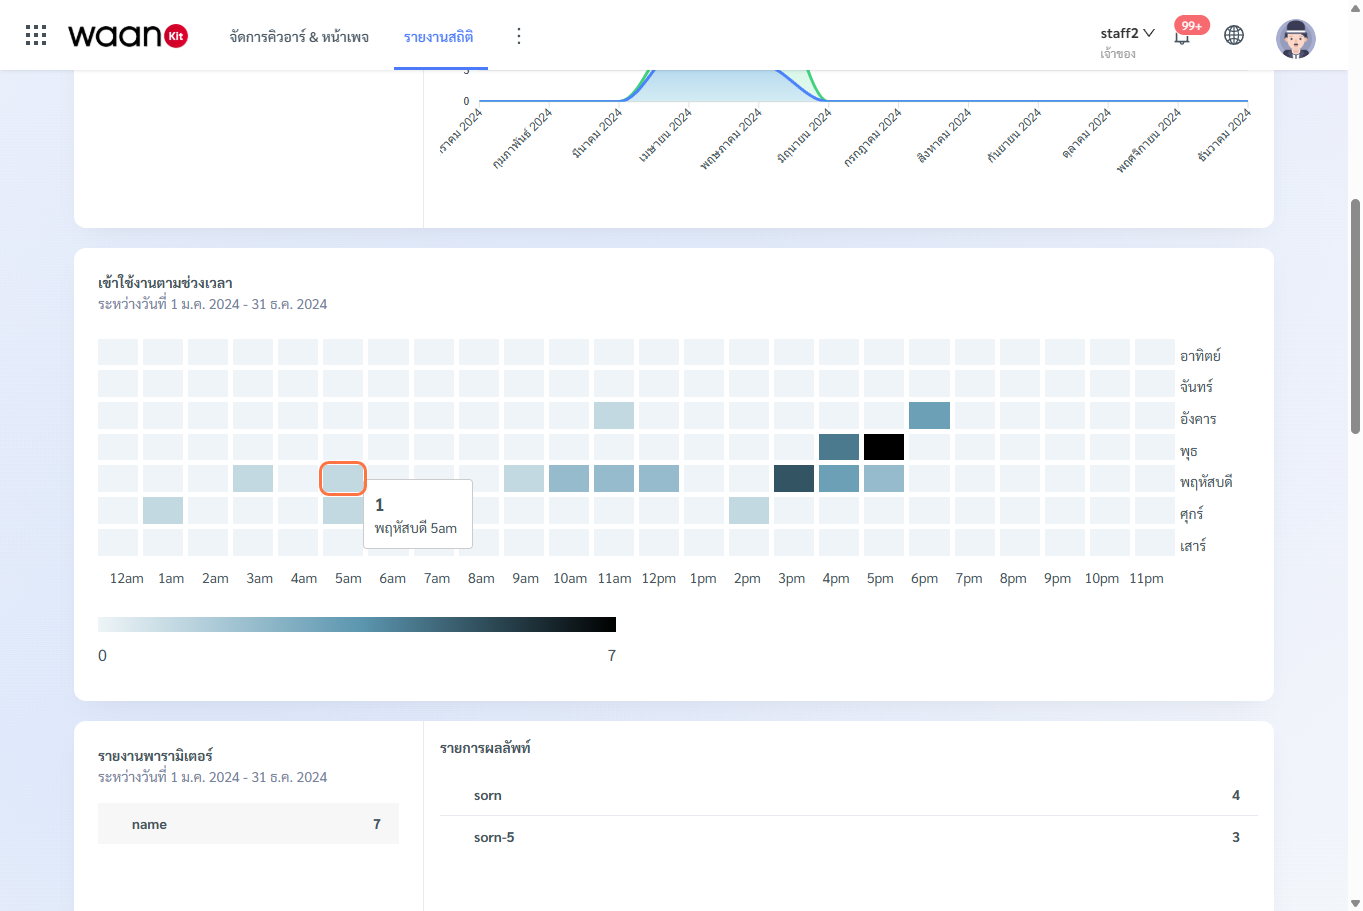
The heatmap maps scan and visit density onto an interactive 24-hour by 7-day matrix (Sunday through Saturday):
1.1 Reading the Heatmap
- Horizontal Axis (X): 24 hours of the day ranging from
12am(midnight) to11pm. - Vertical Axis (Y): 7 days of the week (Sunday, Monday, Tuesday, Wednesday, Thursday, Friday, Saturday).
- Color Density Scale:
- ◻ Light / Pale Squares: Low traffic or inactive time slots.
- Dark / Dense Squares: High-volume traffic surges (Peak Engagement Hours).
- Interactive Tooltip: Hover over any individual cell to view exact scan counts for that specific day and hour.
1.2 Practical Business Applications
- Frontline Staff Scheduling: If Friday and Saturday from 6:00 PM to 9:00 PM show the darkest saturation, roster additional service staff or receptionists during these peak hours.
- Timing Flash Promos & Social Broadcasts: Schedule broadcast notifications 30 minutes prior to detected peak scan times to maximize conversion rates.
- Outdoor Billboard Effectiveness: Evaluate whether commuting foot traffic scans your billboard displays more heavily during morning commutes or evening returns.
2. Exporting Analytics to Excel (.xlsx)
Export full-dimension telemetry datasets as standard Microsoft Excel (.xlsx) spreadsheets for archival, executive presentations, or loading into Power BI and Looker Studio.
2.1 Step-by-Step Export Process
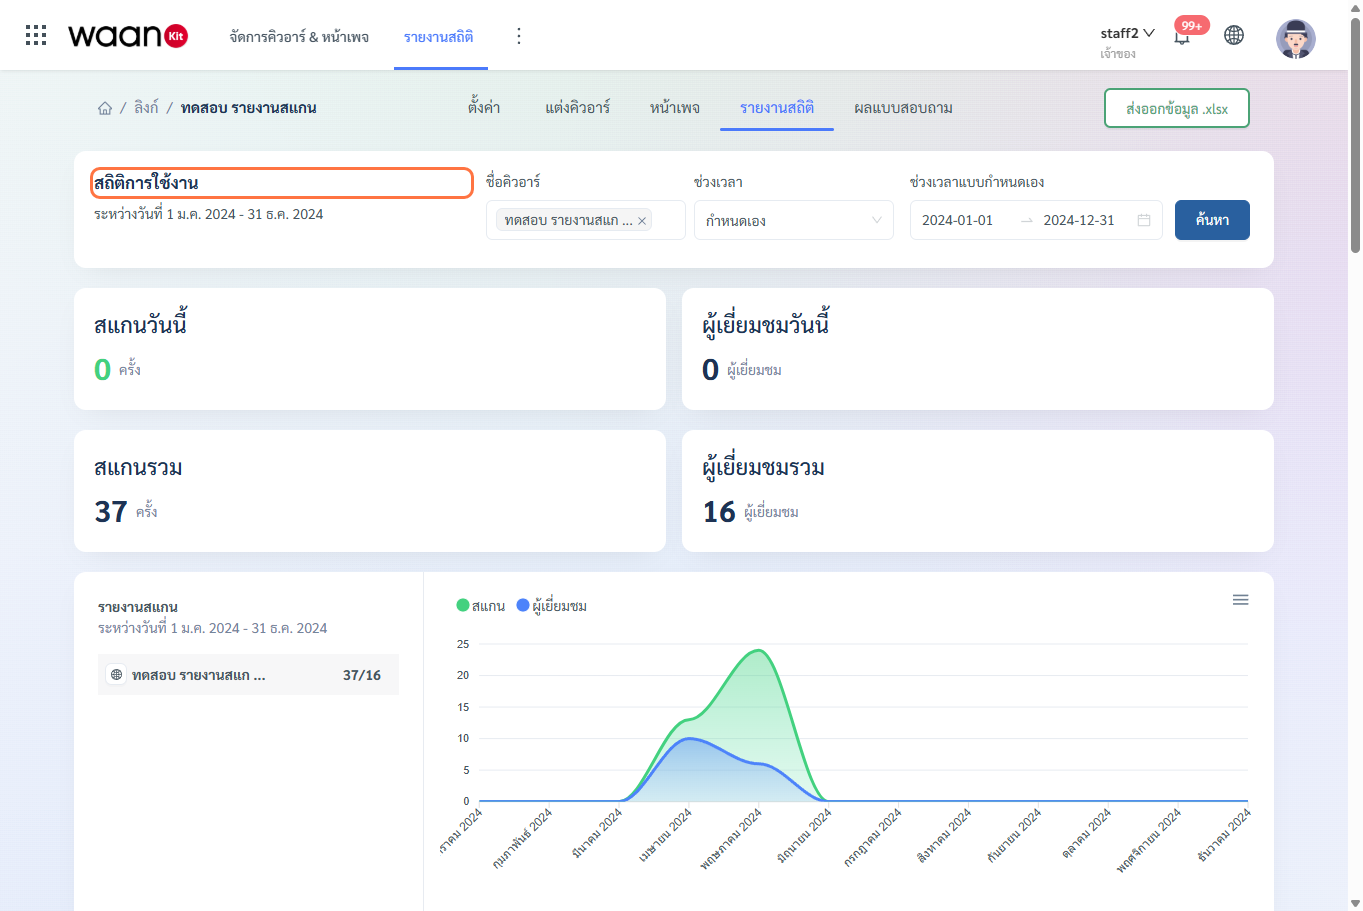
- Open the Analytics Reports section (
/app/apps/nfc/statistics). - Select your desired QR Link and Time Period.
- Click the green "Export Data .xlsx" button at the top right.
- The system will compile all analytical dimensions and download the spreadsheet file to your device immediately.
2.2 Workbook Data Structure
The exported Excel workbook organizes data into structured sheets:
- Summary Facts: Total scans, unique visitor volume, and daily aggregated time-series metrics.
- Technology & Devices: Operating Systems (OS), Device Categories, Web Browsers, Screen Resolutions.
- Geography & Channels: Countries, Provinces/Regions, Device Languages, URL Referrers.
- Marketing Telemetry: Complete UTM Campaign parameters.
- Business Cards: Employee names, individual scan counts, and vCard address book downloads.