

BI Analytics Dashboard & Data Intelligence
WaanKit's business intelligence reporting module provides real-time tracking, behavioral analytics, and performance measurement across your Smart Links, Dynamic QR Codes, Landing Pages, and Digital Business Cards.
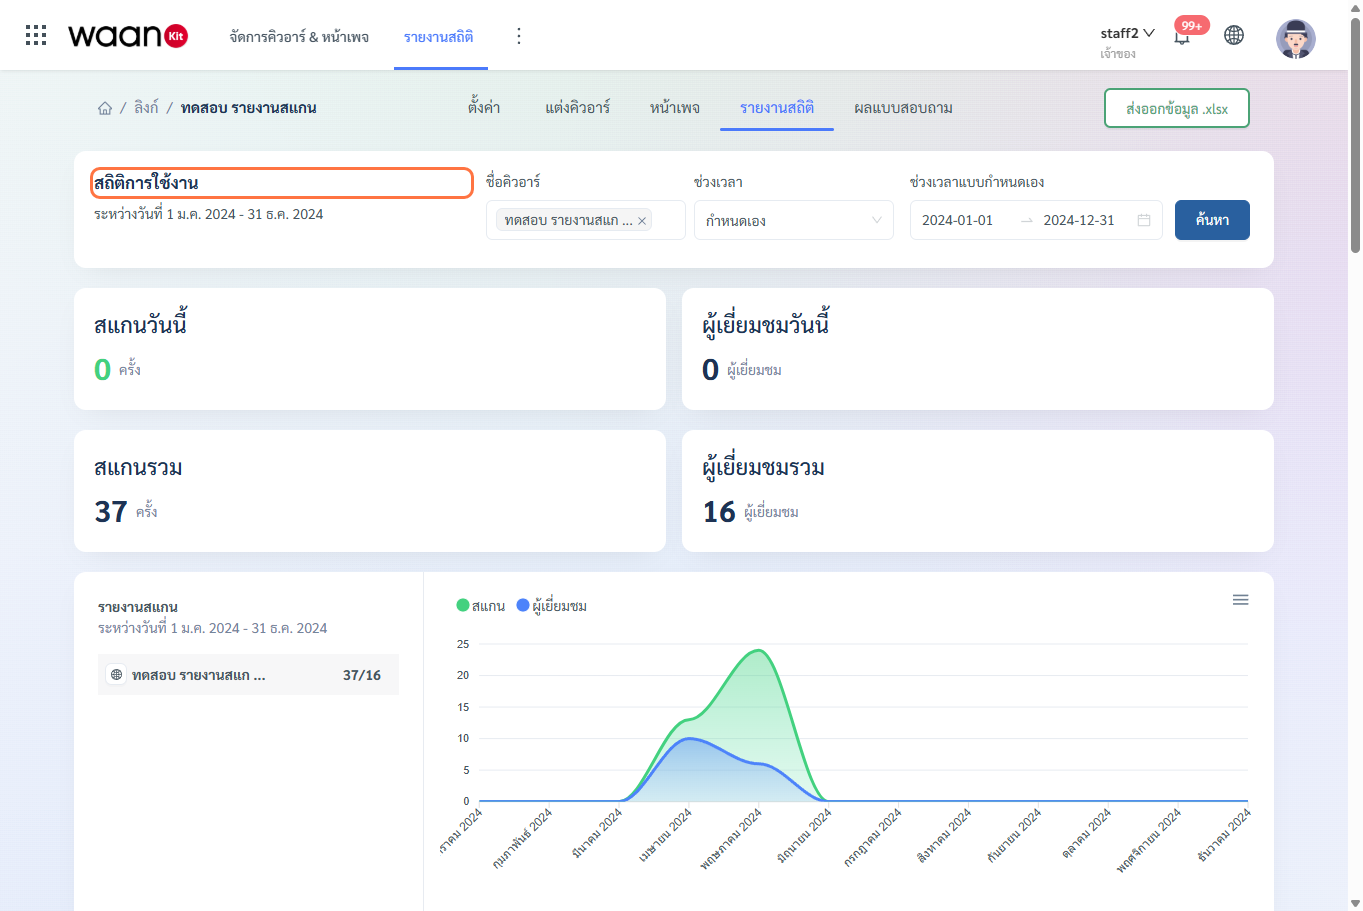
1. Accessing & Navigating Analytics Filters
1.1 Accessing the Analytics Module
- Click "Analytics Reports" in the primary top navigation, or
- From the all-links dashboard, open any Smart Link and select the "Analytics" tab.
1.2 Configuring Filter Parameters
- Smart Link Selector: Search and filter by individual links or observe aggregated multi-link datasets.
- Time Window Selector:
- Today
- Last 7 Days
- This Week / Last Week
- Last 30 Days
- This Month / Last Month
- Custom Date Range Picker
- "Search" Button: Query and fetch data based on selected filter criteria.
2. The 4 Core KPI Metric Cards
The top overview cards present primary performance metrics at a glance:
| Metric Card | Description & Calculation | Business Intelligence Value |
|---|---|---|
| Scans Today | Total scan and redirect hits received today | Measure real-time daily campaign responsiveness and venue activity |
| Visitors Today | Unique devices/browsers recorded today | Identify true individual customer reach without double-counting repeat scans |
| Total Scans | Aggregate scan count within the selected time window | Measure customer engagement frequency and physical touchpoint activity |
| Total Visitors | Total unique individuals reached across the period | Assess campaign reach and brand discovery volume |
3. Interactive Time-Series Trend Line Chart
The time-series chart reveals scan volume progression across hours, days, or months:
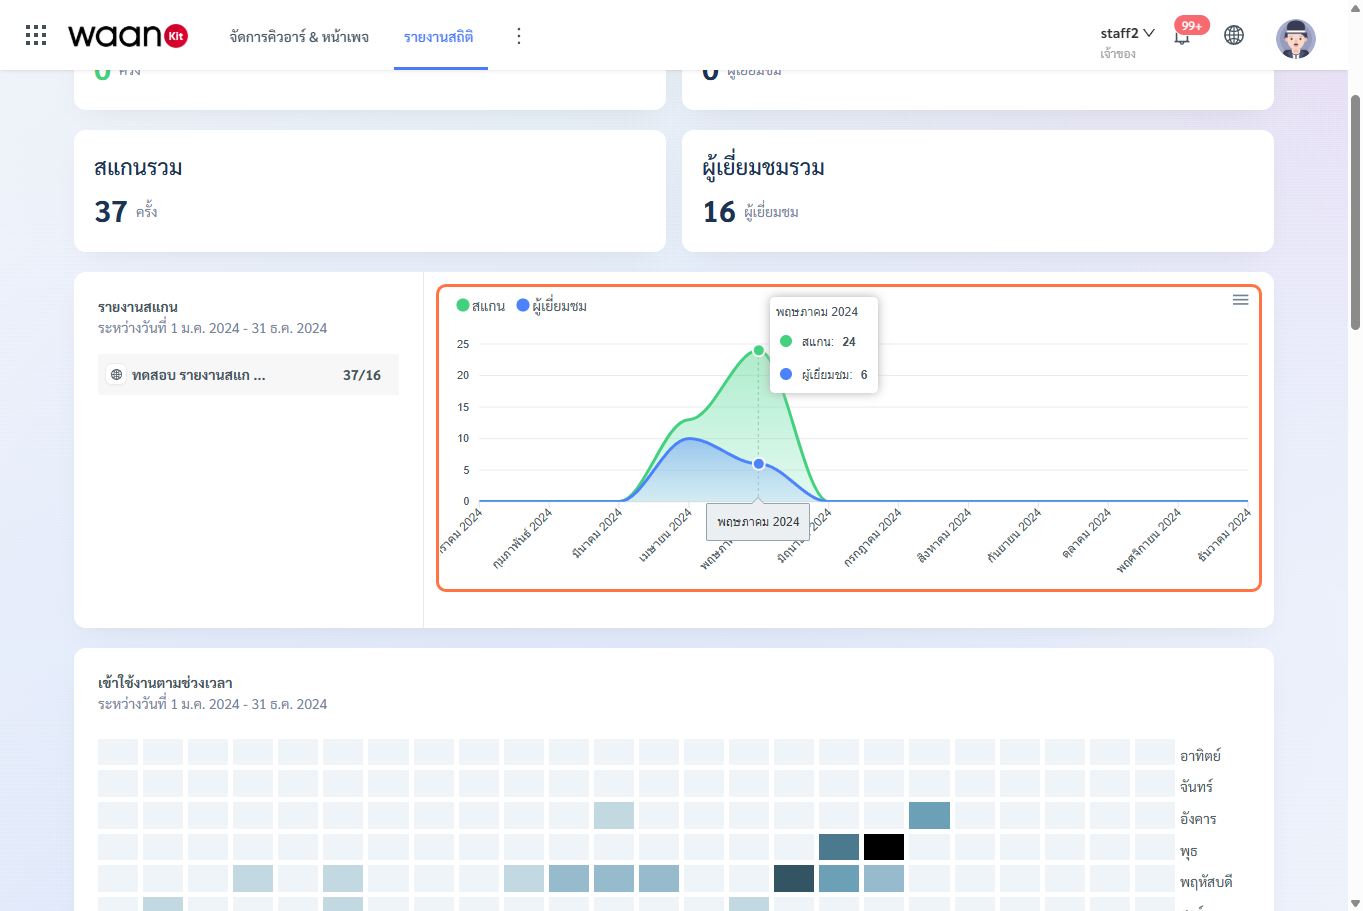
- Green Line (Total Scans): Total scan frequency over time.
- Blue Line (Unique Visitors): Net unique audience count over time.
- Interactive Tooltip: Hover over data points to inspect exact daily figures.
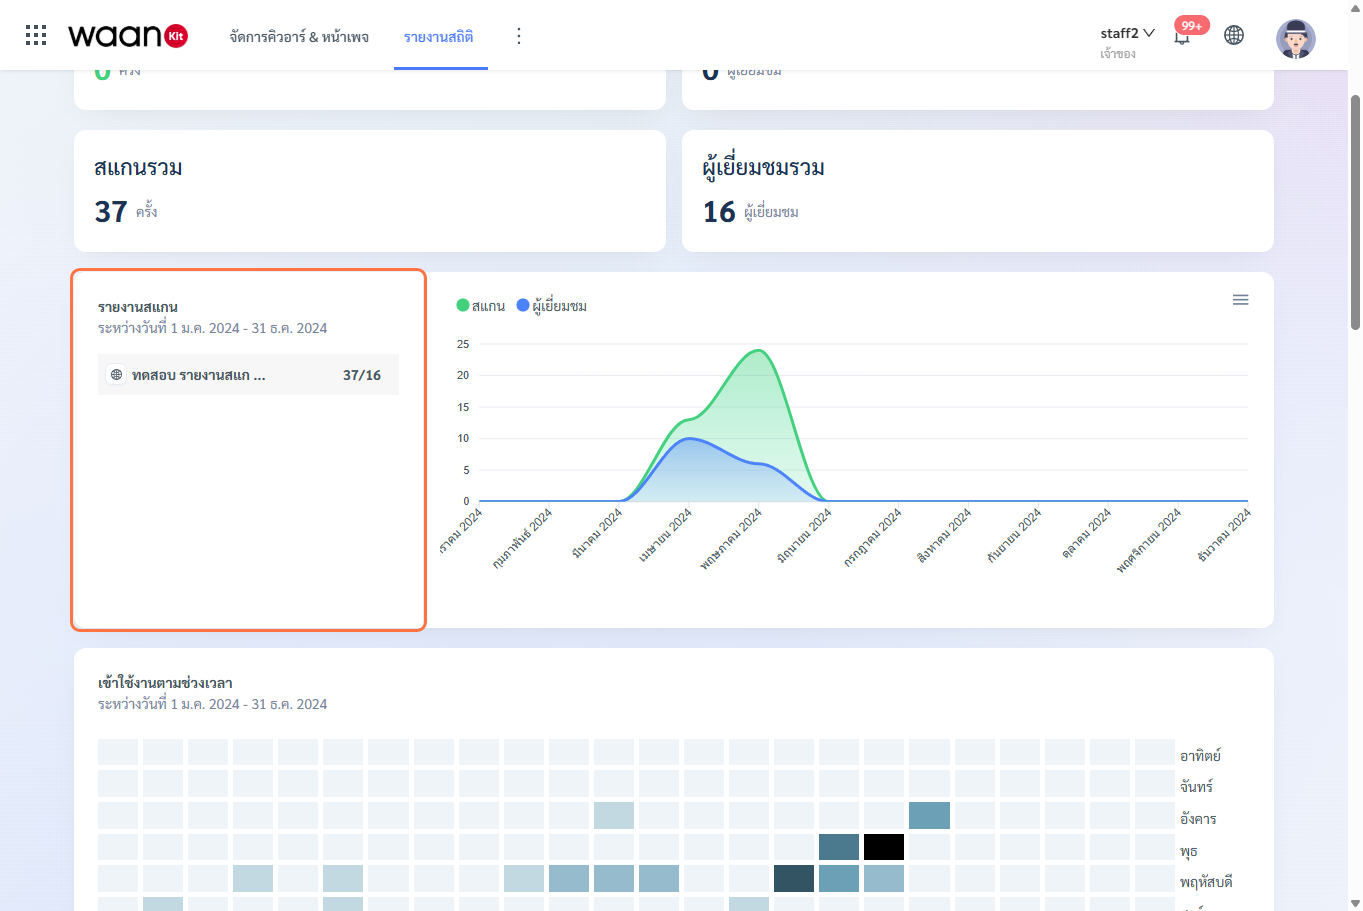
- Sub-link Scan Breakdown (Left Panel): Compare relative proportions and scan volumes between individual links in a group.
4. Digital Business Card Performance Analytics
For teams utilizing Digital Business Cards, a dedicated card performance table ranks individual team members:
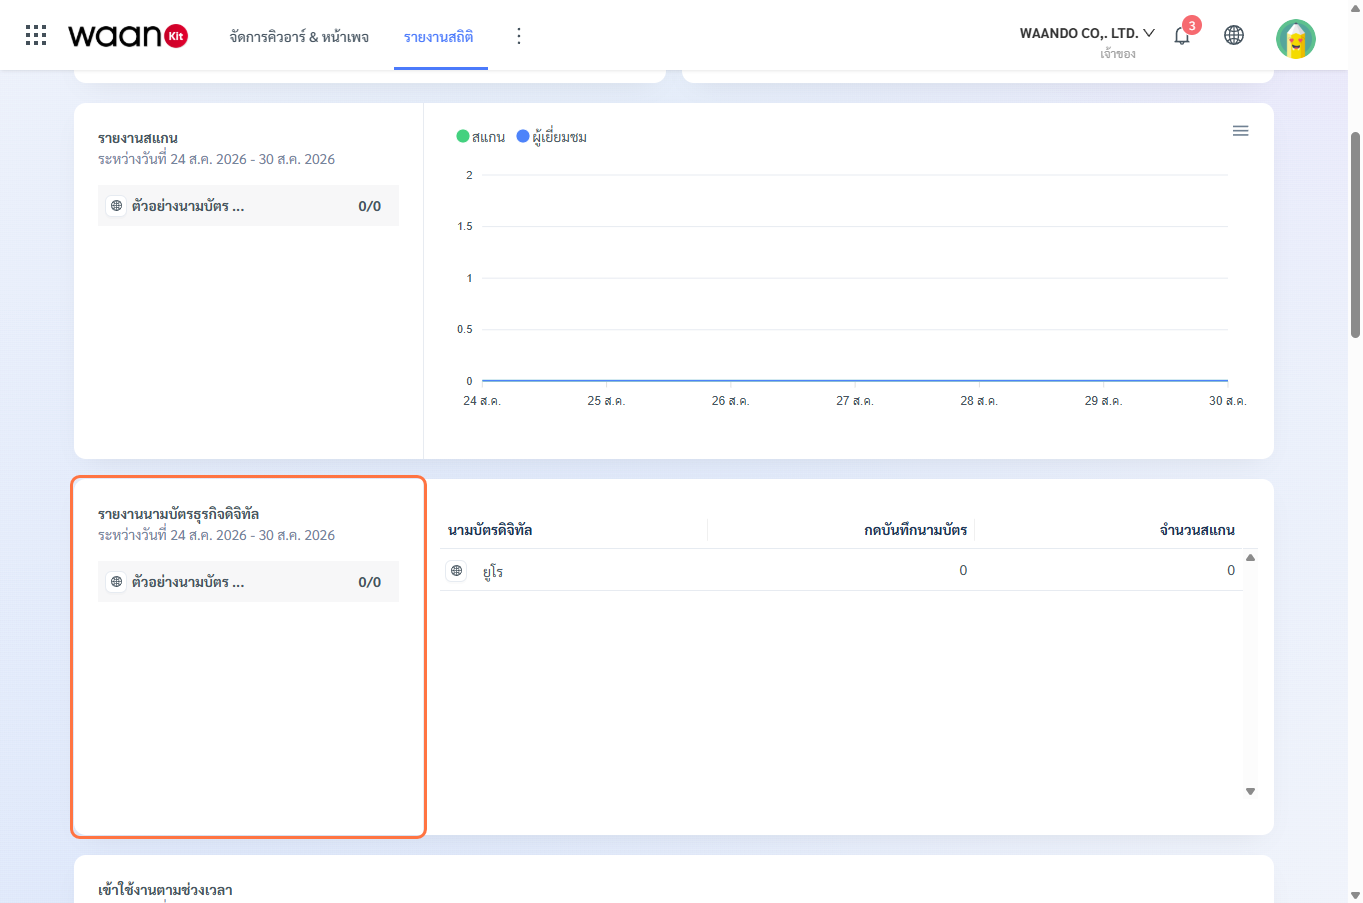
- Business Card / Staff Name: Name and department of the cardholder.
- Save to Contacts: Frequency of customers clicking to save the employee's
.vcfvCard file directly into their phonebook. - Total Scans: Number of times the NFC physical badge or QR code was tapped/scanned.
[!TIP] Sales Team Benchmarking: Comparing the ratio of Save to Contacts against Total Scans provides quantifiable insights into lead capture effectiveness and networking ROI for your frontline representatives.